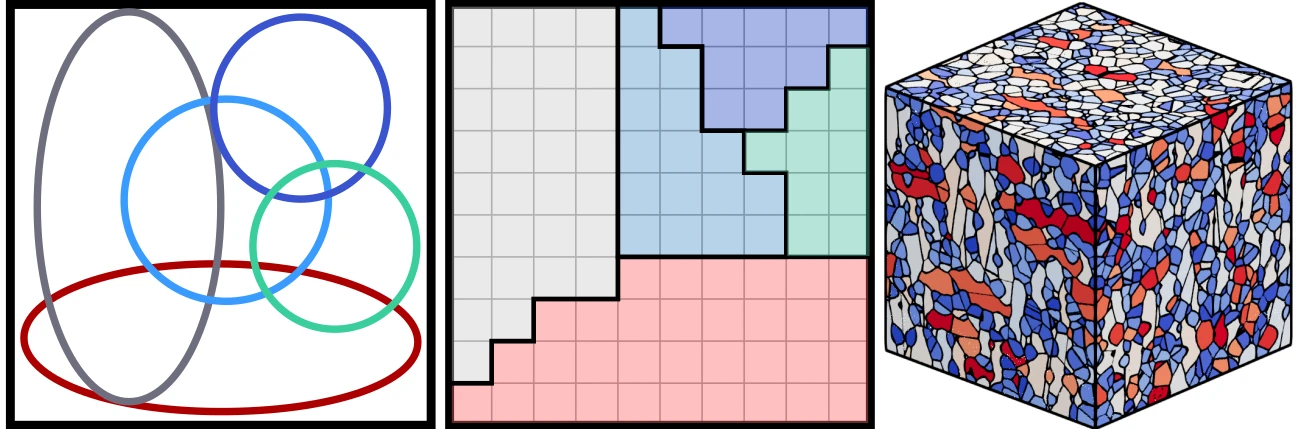
Modelling microstructure
Microstructures as optimal clusterings, with anisotropic power and polynomial diagrams computed by semi-discrete optimal transport on the GPU that capture the grains of real metals and their crystallographic structure, in collaboration with Tata Steel.
An illustration: each grain is a cell of an anisotropic power diagram, with its own orientation and anisotropy, and the seeds drift slowly. drag a seed
Overview
Polycrystalline materials such as steels are made of grains that differ in size, shape and crystallographic orientation, and this microstructure governs their mechanical behaviour. Modelling it requires a compact geometric description of the grains: one that reproduces measured microstructures, for instance from electron backscatter diffraction (EBSD), and generates synthetic ones for simulation. This line of work is carried out in collaboration with Tata Steel.
We describe a microstructure as a generalised Voronoi diagram. Each grain is the set of points closest to a seed in a grain-dependent sense,
where is a positive definite matrix encoding the grain’s shape and orientation, and is a weight. With the identity these are power diagrams, with flat grain boundaries; general give anisotropic power diagrams, with curved boundaries and elongated grains. Choosing the weights so that each grain has a prescribed volume is a semi-discrete optimal transport problem, which we solve efficiently on the GPU.
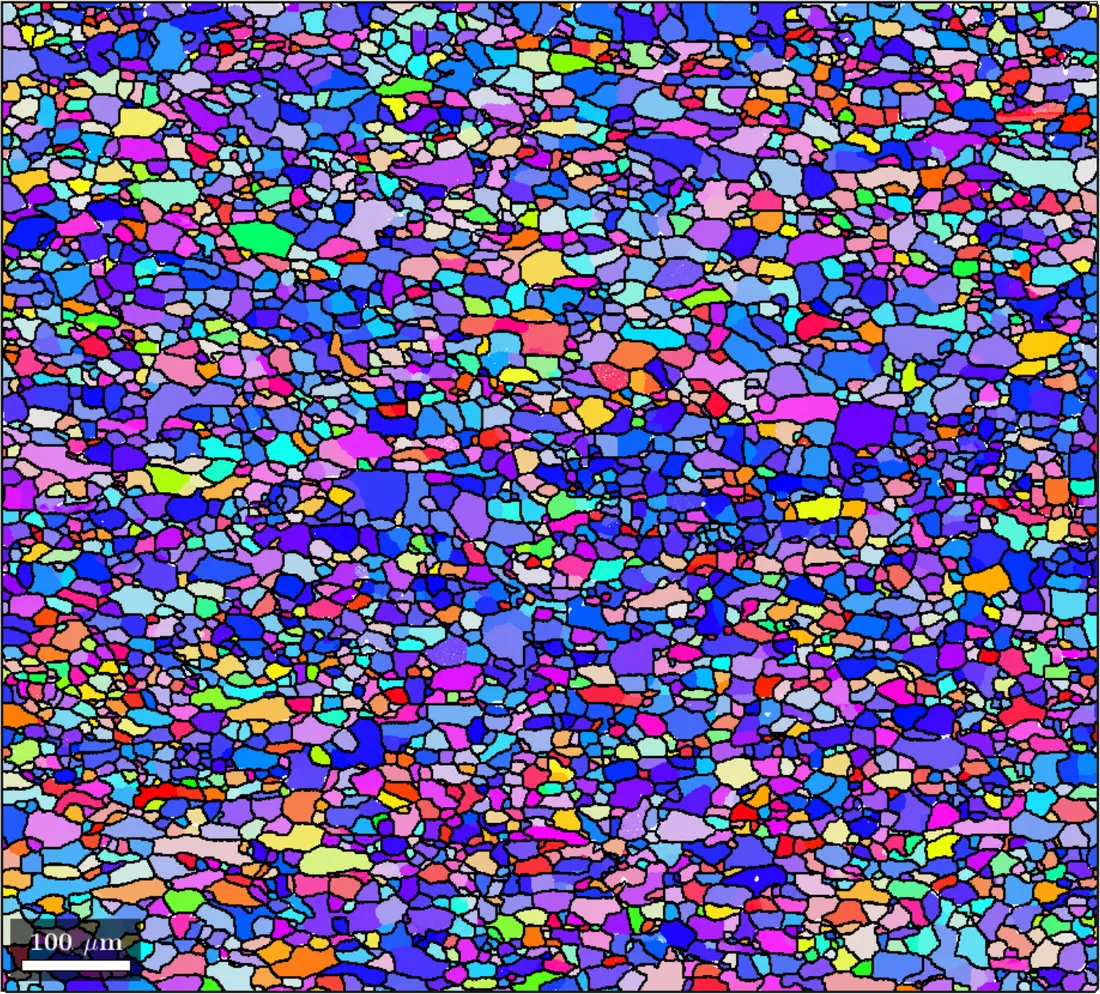
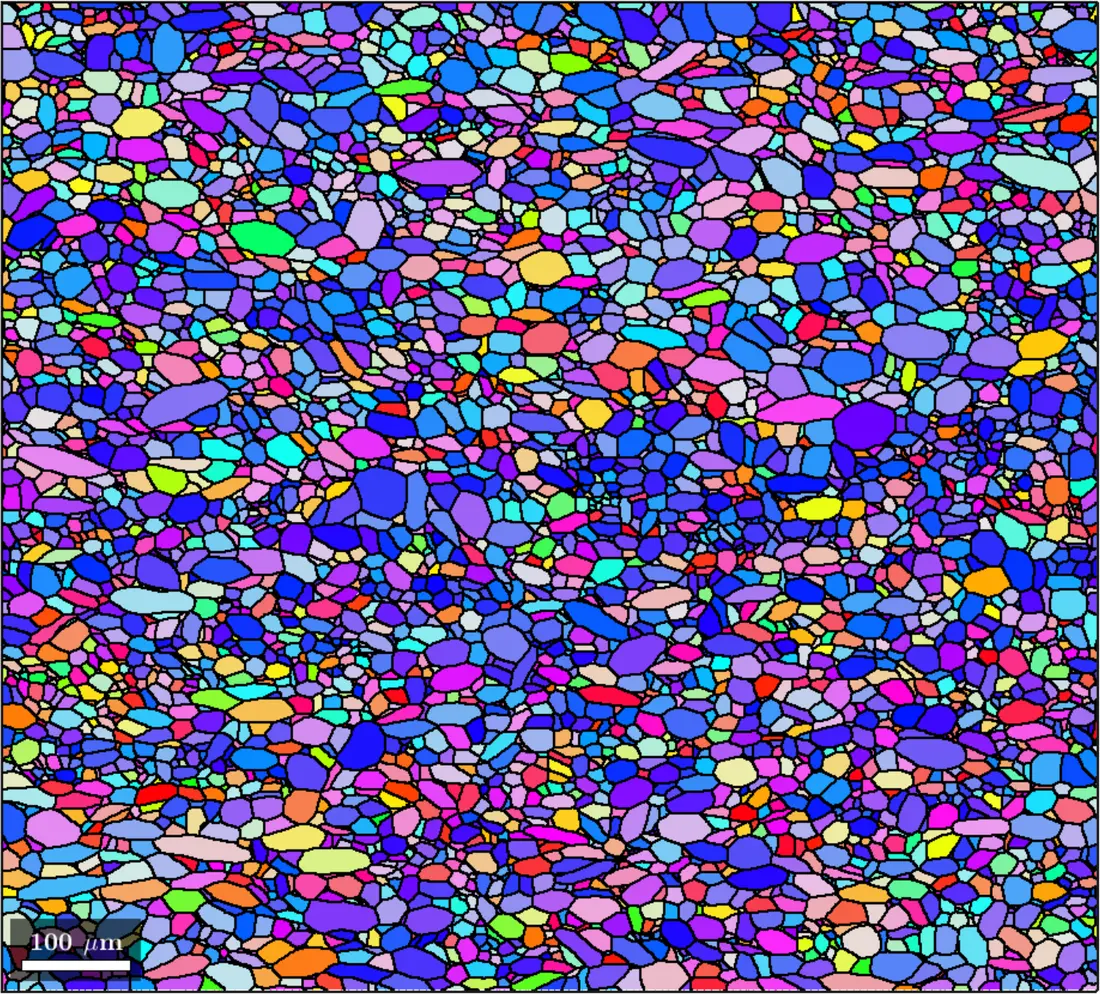
Polynomial diagrams go one step further. Power diagrams and anisotropic power diagrams are the first- and second-degree instances of linear parametrised minimisation diagrams, in which each cell minimises a function that is linear in its parameters. Allowing polynomials of higher degree gives cells whose boundaries are algebraic curves of prescribed degree. We fit such diagrams to images by maximising a regularised concave objective adapted from logistic regression, with Legendre polynomials as the basis and a GPU implementation. The analysis identifies the scale and gauge invariances of the problem and the limiting objective as the regularisation vanishes, and the method reproduces EBSD images of steel.
Publications
-
Polynomial diagrams for microstructure modelling.
arXiv preprint (2026). under review
arXiv
bibtex
@misc{bourne2026polynomial, title = {Polynomial diagrams for microstructure modelling}, author = {D. P. Bourne and M. Buze and T. Gallouët and Q. Mérigot}, year = {2026}, eprint = {2605.20816}, archivePrefix = {arXiv}, } -
Anisotropic power diagrams for polycrystal modelling: efficient generation of curved grains via optimal transport.
Computational Materials Science 245, 113317 (2024).
arXivdoicode
bibtex
@article{buze2024apd, title = {Anisotropic power diagrams for polycrystal modelling: efficient generation of curved grains via optimal transport}, author = {M. Buze and J. Feydy and S. M. Roper and K. Sedighiani and D. P. Bourne}, journal = {Computational Materials Science}, volume = {245}, pages = {113317}, year = {2024}, doi = {10.1016/j.commatsci.2024.113317}, eprint = {2403.03571}, archivePrefix = {arXiv}, }
Collaborators
- David Bourne
- Steven Roper
- Jean Feydy
- Karo Sedighiani
- Thomas Gallouët
- Quentin Mérigot
- Dawid Lipinski
Software
- PyAPD A Python library for anisotropic power diagrams and polynomial diagrams in 2D and 3D, GPU-accelerated with KeOps: optimal diagrams with prescribed grain volumes, fine control of shape and orientation, and fitting to EBSD data. Install with
pip install PyAPD.